Algebraic solutions of linear inequalities in one variable and their representation on the number line
Recalling the definition of linear inequalities, “it is an equation that carries a linear function.” It could further be expressed as the relation between two algebraic expressions that are represented using inequality symbols. It is a concept similar to linear equations. However, in place of the equality sign, there are inequality symbols. For instance, consider:
$y=2x+1$ (Linear equation)
$y>2x+1$ (Linear inequality)
Solving Linear Equations in One Variable
Solving linear inequalities is much similar to solving linear equations (i.e. step-by-step). While solving linear inequalities the following rules need to be considered:
Rule-1: Equal numbers may be added or subtracted from both sides of the considerable inequality without having any effect on the sign of inequality.
Rule-2: Both the sides of an inequality could be divided or multiplied to the same positive number. However, when this is done with a negative number, the sign of inequality would be reversed. For instance, – 8 < – 7, whereas (– 8) (– 2) > (– 7) (– 2) i.e. 16 > 14 and 3 > 2 while – 3 < – 2.
Graphical representation of inequalities in one variable
The solutions of inequalities in one variable could be the graphed on the Euclidean plane. While dealing with inequalities in one variable, the graph would probably be a number line. Since there is only one variable, it would be represented on the number line. This process would be the same as plotting a number on the number line.
Steps for graphing a solution on the number line
- We would first need to solve the inequality, applying the rules of inequality to find the solution.
- Make a number line
- Plot the point on the number line
- To represent strict inequality (which includes > (greater than) and < (less than) signs), use open circles. This would indicate that the points plotted on the number line are not to be included in the range of solutions for the considerable inequality.
- For representing slack inequalities (which include ≥ (greater than or equal to) and ≤ (less than or equal to) signs) use closed or filled circles. This would be an indication that the points plotted on the number line are to be included in the solution range of the inequalities.
- Further, shade the number line according to the signs of inequality.
- For the signs > and ≥ shade the left of the point marked on the number line.
- For signs < and ≤, shade the right of the point marked on the number line.
Given below are a few examples for the same:
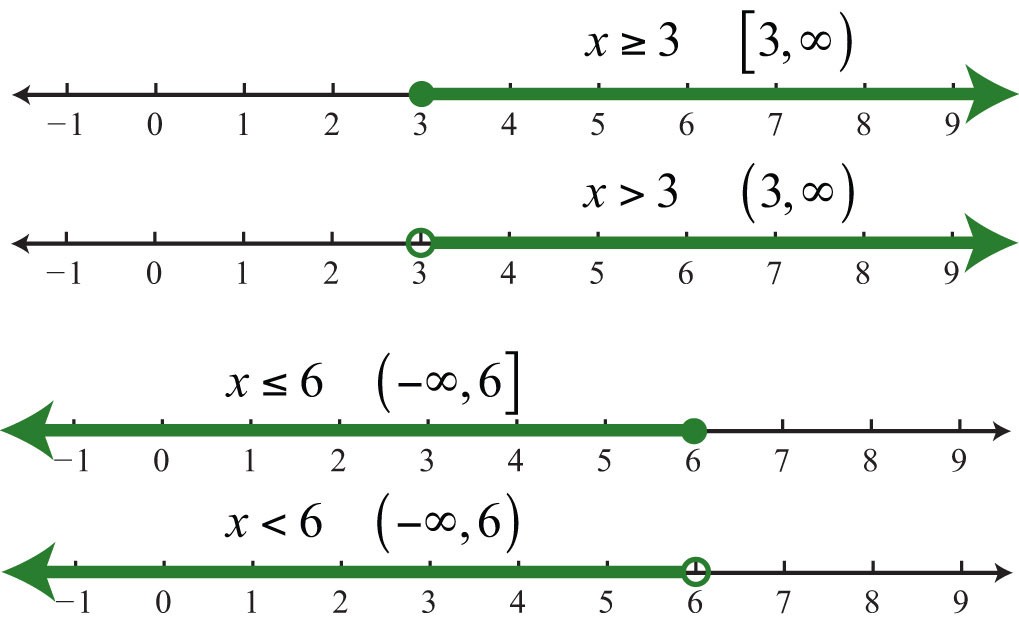
The shaded portion on the number line is known to represent the range of true values for the considerable inequality.