While you may be clarifying the concepts of functions and relations, considering pictorial and graphical representation of concepts would be of great help to understand things even better.
Graphical representation of a function
Now when you’re already aware of what are functions, we would straight away move towards its graphical representation. Suppose that a function f : R – {0} → R has been represented on the coordinate in a way that the x coordinate is known to represent the independent variable and the y coordinate represented the dependent variable. The graph of a function could be helpful in showing various properties of the respective function even more clearly and directly. The limiting case for the graph of the function is said to be shown by the asymptote.
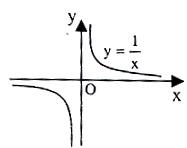
Asymptote means the straight line along which the function approaches infinity does not actually touch it as the figure illustrates. As per this situation, Coordinate axis x = 0 would be regarded as an asymptote to the graph of y = 1/x.
Given below are the examples of several other functions and their graphical illustrations.
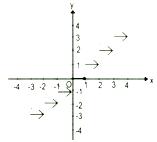
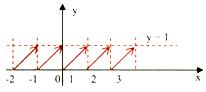
Constant Function

f : R → {c}
Defined as f{x} = c
Identity function
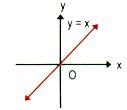
f : R → R
Defined as f(x) = x
Exponential Function
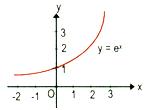
f : R → (0, ∞)
Defined as f(x) = ex
Logarithmic Function
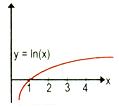
f: (0, ∞) → R
Defined as f(x) = In x
Greatest Integer Function
f : R → Z
Defined as f(x) = [x]
The greatest integer < x
Fractional part of x
f : R → R
Defined as f(x) = {x}
The different function graphs could be identified by the properties that are exhibited by the graph. Also, you already know that the domain and range for it could be identified with the fact that the values for domain are represented on the x axis and the values for the range are represented on the y axis.
Graphs could be helpful in identifying whether or not a relation is a function. Using a vertical line test, you can make out whether the graph showcases a function. A vertical line would include all the points that relate to the x values. The y value where this vertical line intersects the graph is known to represent the output for that value of x.
If the vertical line you’ve drawn intersects the graph more than once, the relation plotted on the graph would not be a function. This is because a function could have only one output value for each input value.