Graphical solution of system of linear inequalities in two variables
A system of linear inequalities in two variables is known to be the one that consists of at least two inequalities with the same variables. The solution for such inequality is known to be the ordered pair which could be the solution to all the inequalities included in a system. Also, the graph of linear inequality is regarded to be the graph for solution of the system. Therefore, in order to solve the systems, the solution sets of inequalities need to be graphed on the given set of axes and determine where they would intersect. This overlapping or intersection would determine the region of common ordered pair solutions.
Graphical method for solving system of linear inequalities in two variables
Graphical Method could be the easiest to find solutions to systems of linear inequalities in two variables. Here, the process of graphing would remain similar to the one that prevails for linear inequalities in two variables.
Steps involved
- Firstly, make sure to plot all the given lines of inequalities given on the same Cartesian plane. In the system of linear inequalities, there could be two or even more lines of inequalities.
- For < or > sign, make a dotted line. And for ≤ or ≥ sign make a bold line.
- Now, as per the sign of inequality, shade the solution region. It may include < or ≤, below the line and > or ≥ sign for above the line.
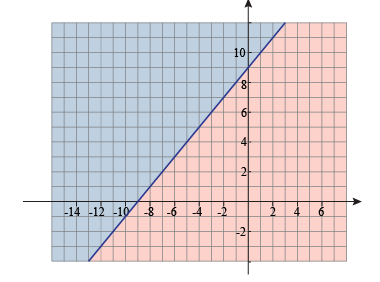
As in the image, above the line and below the line portions have been separated by the different colors.
- The solution of the system of inequalities would be the shaded region that would be common for all the lines of inequalities.
- The solutions could be the following:
- No solution
- Closed or bounded
- Open or unbounded
Consider the example given below:
Y > -3x +5
Y ≤ x-2
Solution: you will be required to draw the inequalities on the Cartesian plane first. Since the first one is a strict inequality, draw a dotted line for it and shade the region above the line. For the second inequality, draw a solid line since it is a slack inequality and shade the region below it.
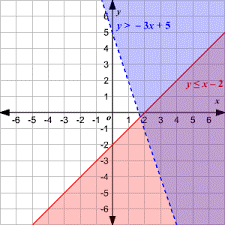
The solution for this system of inequalities is the intersected shaded region or the one that is common to both the inequalities.
With the help of above illustrations, you can find solutions to the system of inequalities.