Statistics – Analysis of frequency distributions with equal means but different variances
The coefficient of variation is a measure of the relative variability (or consistency) of two or more data sets. It is calculated by taking the ratio of the standard deviation divided by the mean. It may also be expressed as a percentage to show relatability.
Population coefficient of variation: $C.V= \frac{\sigma }{\bar{x}}\times 100 , \bar{x}\ne 0$
Sample coefficient of variation: $.V= \frac{s}{\bar{x}}\times 100 , \bar{x}\ne 0$
A dataset with higher C.V is more variable and one with lower C.V is more consistent.
To compare two frequency distributions with the same mean we use C.V to analyse the distribution variance of one from another.
Let $\bar{x}_{1}$and $\sigma _{1}$ be the mean and SD of the first frequency distribution data, and $\bar{x}_{2}$and $\sigma _{2}$ for the second distribution.
$C.V_{1}= \frac{\sigma _{1}}{\bar{x}_{1}}\times 100$
$C.V_{2}= \frac{\sigma _{2}}{\bar{x}_{2}}\times 100$
Since $\bar{x}_{1} $and $\bar{x}_{2}$ are equal, we can compare the two series using standard deviation only. From the equations, we notice that SD is directly proportional to CV. This means that a series with greater SD is more variable or more dispersed than the other. And, a lesser value of SD indicates more consistency in the frequency distribution of a dataset.
Example: The coefficient of variation of two frequency distributions are 60
Example: The following values are calculated with respect to the height and weight of the class XI students. Comment on the variance of height and weight of the students. To compare the variation, we need to find out the coefficient of variation. Variance of height = 120cm2 SD = $\sqrt{120}=10.95 cm $ Variance of weight = 50 kg SD = $\sqrt{20}=4.47$ CVheight = $\frac{10.95}{120}\times 100=9.125%$ CVweight = $\frac{4.47}{50}\times 100=8.94%$ Since CV in height is greater than a CV in weight, we can conclude that height shows more variability than weight. Example: Two plants X and Y of a reactor show the following results about the number of workers and wages paid to them. The SD for plant X = $\sqrt{81}=9$ The SD for plant Y = $\sqrt{100}=10$ Since the average monthly wages of both the plants are the same: Rs. 2500. Plant Y has more variability in individual wages than plant X 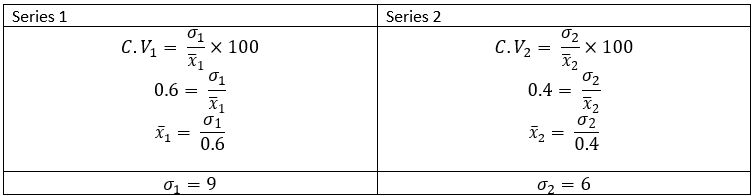
Height
Weight
Mean
160 cm
50 kg
Variance
120 cm2
20 kg2
X
Y
No. of workers
4000
500
The variance of the distribution of wages
81
100
Average monthly wages
Rs. 3000
Rs. 3000