The graph of y = sin x can be visuallised in the figure below:
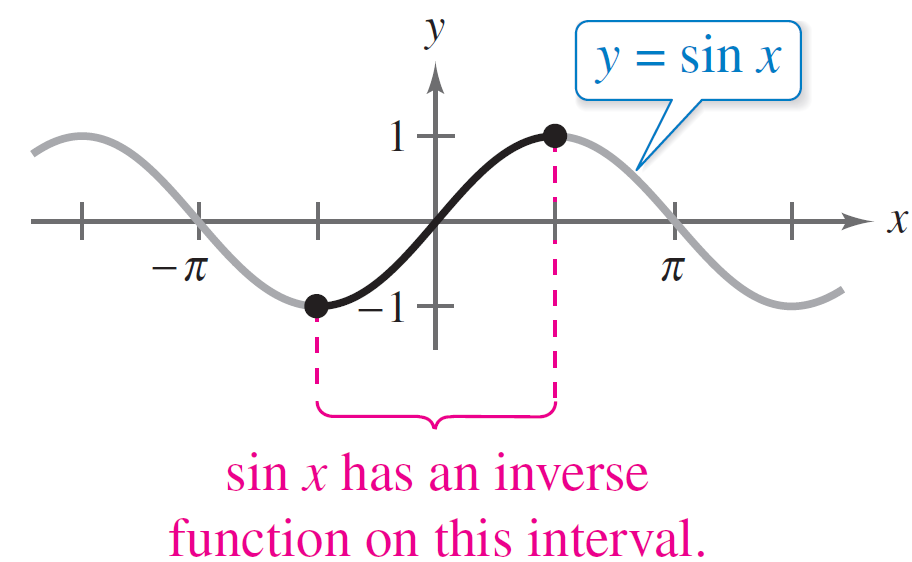
Domain: all reals Range: [-1,1] Period: 2π Y-intercept: (0,0)
When you restrict the domain of sin x to the interval –π/2 ≤ x ≤ π/2, the following properties should hold:
1.y = sin x is an increasing function.
2.y = sin x utilizes full range of values, –1 ≤ sin x ≤ 1.
3.y = sin x is a one-to-one function.
In conclusion, on the restricted domain –π/2 ≤ x ≤ π/2, y = sinx obtains a unique inverse function called the inverse sine function: y = arcs in x or y = sin–1x. The inverse function is equivalent to the analogy of an inverse function notation f –1(x) which is not the same as (f)-1.
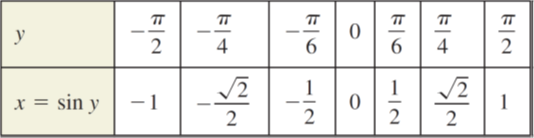
Using the domain: [-π/2 ;π/2] let’s plot the graph y = arcs in x. Remember that y = arcs in x can be written as sin y = x
The graph of y = arcsin x
![\psfrag{pb2}{$\textstyle \frac{\pi}{2}$}\psfrag{-pb2}{$\textstyle -\frac{\pi}{2}... ...$\textstyle arcsin(x)$}\includegraphics[height=0.7\textwidth]{xfig/arcsin-x.eps}](https://www.w3schools.blog/wp-content/uploads/2019/11/psfragpb2dollar-textstyle-frac-pi2dollar-psfrag-p.png)
Domain: $[$-1, 1$]$ Range: $[-\frac{\pi }{2},\frac{\pi }{2}]$
Similarly, we can use 1-1 cos x values to plot the graph of arccos x. The cosine function is a decreasing function and it forms one-to-one values on the interval 0 ≤ x ≤ π, as shown in the figure below:
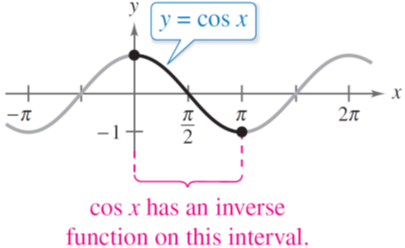
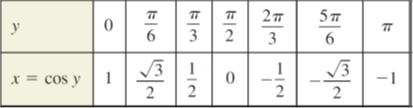
On this interval, the cos x has an inverse function denoted by y= arccosx or y = cos–1x. Because y = arccosx and x = cos y mean the same for 0 ≤ y ≤ π, their graphs are the same, and can be confirmed by the following table of values.
The graph of y = arccos x
![\psfrag{pi}{$\textstyle\pi$}\psfrag{pb2}{$\textstyle\frac{\pi}{2}$}\psfrag{y}{$\... ...$\textstyle arccos(x)$}\includegraphics[height=0.7\textwidth]{xfig/arccos-x.eps}](https://www.w3schools.blog/wp-content/uploads/2019/11/psfragpidollar-textstyle-pidollar-psfragpb2dollar-textsty.png)
Domain: [-1, 1] Range: [0, π] Period: Y-int: [0, 0]
The other trigonometric functions require similar restrictions on therefor generating an inverse function.The domain of the section of the tangent that generates the arctan is and the inverse tangent function is denoted by y = arctan x or y = tan –1x. Since y = arctan x and x = tan y are the same for –2 <y<2 their graphs are the same, and can be confirmed by the following table of values.
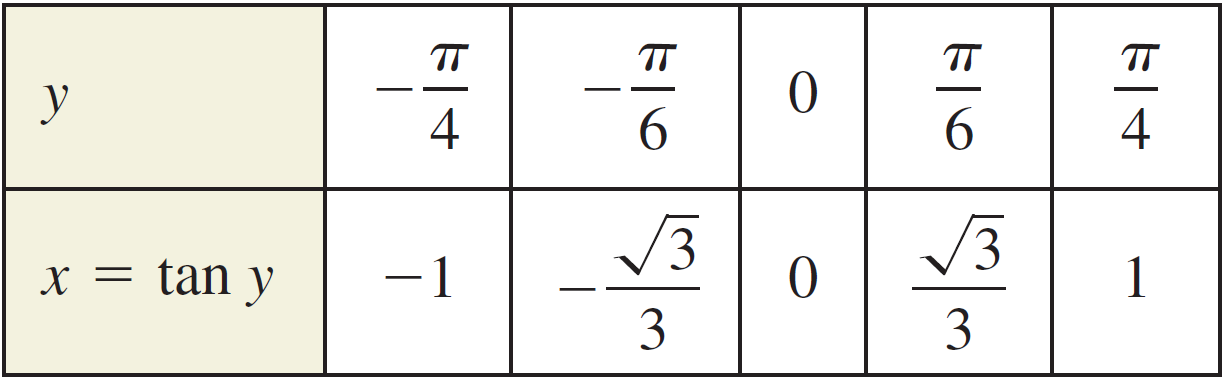
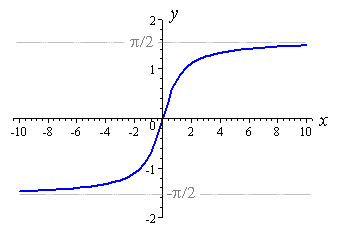
Domain: $[-\infty , \infty $$]$ Range: $[$$\frac{-\pi }{2}, \frac{\pi }{2}$$]$