Statistics – Measures of dispersion: Mean deviation
A mean value is defined as the arithmetic average with which you are the most familiar.Another way to describe the variability of a set of data is to use its mean absolute deviation. The mean absolute deviation of a data set is the average variation between each data value and the mean. A deviation from the mean, x – x bar, is the difference between the value of x and the mean x bar.We base our formulas for variance and standard deviation on the amount that they deviate from the mean.This measure tells us the average (mean) amount that the values for all cases deviate (regardless of whether they are higher or lower) from the average (mean) value.The Mean Deviation is an intuitive quantity which is comprehendible and a reasonable measure of dispersion, and it is occasionally used in research.When compared, a data set with a smaller mean absolute deviation has data values that are closer to the mean than a data set with a greater mean absolute deviation.
Steps to find the mean absolute deviation:
- Find the mean of the data.
- Find the difference between each number from the mean.
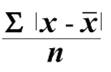
- Add the differences and divide by the number of data. (MD)
Example: Find the mean absolute deviation of the data below: 8, 10, 14, 11, 11, 15, 10, 9
$\bar{x}=\frac{8+10+14+11+11+15+10+9}{8}=\frac{88}{8}=11$
$MD=\frac{\vert 8-11\vert +\vert 10-11\vert +\vert 14-11\vert +\vert 11-11\vert +\vert 11-11\vert +\vert 15-11\vert +\vert 10-11\vert +\vert 9-11\vert }{8}$
$MD=\frac{\vert -3\vert +\vert -1\vert +\vert 3\vert +0+\vert 4\vert +\vert -1\vert +\vert -2\vert }{8}$
$MD=\frac{3+1+3+4+1+2}{8}=\frac{14}{8}=1.75$
Example using the tabular form:
Find MD : 30, 35, 60, 63
$\bar{x}=\frac{30+35+60+63}{4}=\frac{188}{4}=47$
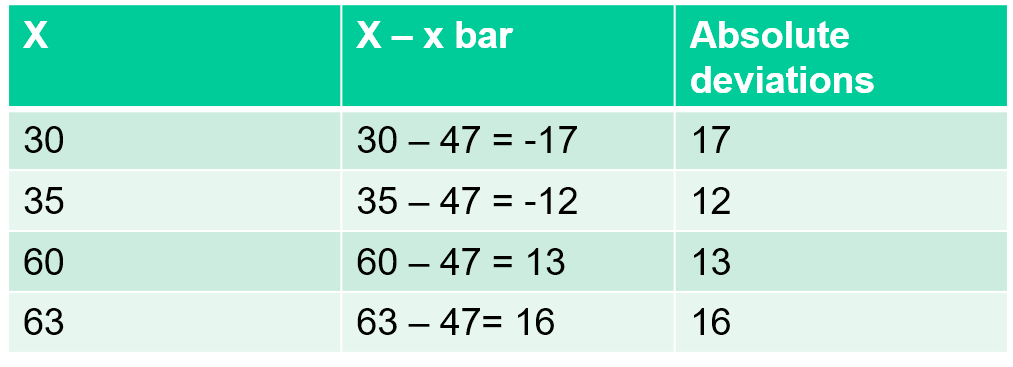
$MD=\frac{17+12+13+16}{4}=\frac{58}{4}=14.5$
A “large” MD indicates that the information is spread far out from the mean. A “small” MD means that the information is more clustered and therefore more predictable.The terms “LARGE” and “SMALL” are relative to each other and their interpretation depends on the type of unit that you are measuring and the nature of comparison with other quantities since no two data sets can be similar in terms of their sample size and quality.
Consider the following example:
- A mean absolute deviation of $200 in the bank account of several professional athletes.
- A mean absolute deviation of $200 dollars in the bank account of several 10 year-olds.
Dollar 200 is a small amount if you are talking about an athlete who makes millions of dollars. But if you are talking about a 10-year-old, Dollar 200 is a lot of money. So for athletes, Dollar 200 is a small impact while for 10-year-olds, Dollar 200 is a large impact.