While you may be dealing with functions and relations, understanding them in pictorial forms makes it rather easier. Mapping diagrams help in the clearer understanding of the relations of numbers in one set of values and the other set of values.
Using Mapping Diagrams
Mapping diagrams prove to be useful while you’re working with functions. They allow tracking the relationships between the inputs and the outputs. These diagrams can be used to make out which input values are tracked to which output values. They also help in ensuring that a function actsually a function. For instance consider that we have the following set of pairs,
Here, the first number is to be considered as the input and the second number is considered as the output.
A function being a special relation where one element in the domain is paired exactly with only one element in the range set. Mapping shows the pattern in which the elements are paired. It is just like a flow chart for a specific function that displays the input and output for the same. Lines or arrows are drawn ascending from domain to range in order to represent the relation between two elements.
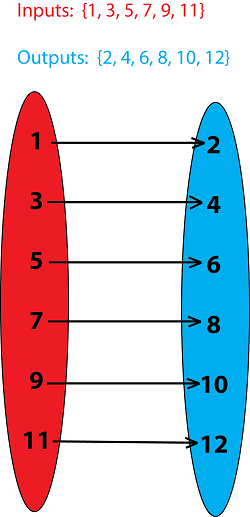
One-to-one Mapping
In the above image, the function represented by mapping above, here each element of the pair is ranged with exactly one element on the opposite sides. This is referred to as, one-to-one mapping.
Many-to-one Mapping
In the second image, the elements in the range set associate with probably more than one element in the range set. In case, the elements in range are known to be mapped with more than one element in the domain set, it would be called many-to-one mapping.
One-to-many Mapping
In this type of mapping, the first element in the domain set is known to be mapped with multiple elements in the range set. In a case like this when one element from the values of the domain set, the mapping indicates one-to-many relations. When one element has its relations with multiple elements, it cannot be termed as a function.
While keeping the elements scattered will make it complicated to understand relations and recognize whether or not they are functions, using pictorial representation like mapping will makes it rather sophisticated to take up the further steps with the mathematical procedures. Undeniably, the relation between various elements of the x values and y values.