Unit VI: Statistics and Probability
Chapter 1: Statistics – Measures of dispersion: Range
In statistics, there are 4 values considered to measure the central tendency and dispersion.
The measure of location or central tendency is a mid-value that the data set is grouped around. It gives an average value.
| Central tendency | Definition |
| Mid-range | 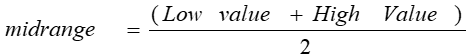 |
| Mean | 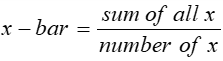 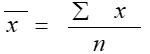 |
| Mode | the middle number positioned in an ordered (ascending ) set of numbers. |
| Median | the number that occurs most often. |
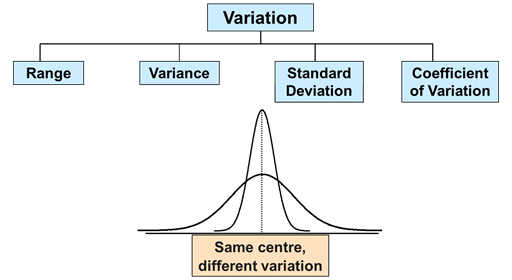
Dispersion is a measure of variability or spread of a set of quantities. Measures of dispersion are descriptive statistics that describe how similar a set of statistical quantities are to each other.
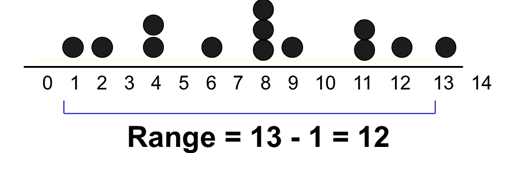
Range: It is the difference between the lowest value in the set and the highest value in the set.
Range = High # – Low #
$R=X_{largest}-X_{smallest}$
Example
The range is used with ordinal data or you to present results to people with little or no knowledge of statistics. It is rarely used in scientific work as it is fairly insensitive. It depends on only two scores in the set of data, high # and low #
Two completely different data sets can have the same range:
1 1 1 1 9 vs 1 3 5 7 9 both have a range of 8
Therefore, range as a measure of dispersion can be misleading as it ignores the way in which a set of data values are distributed and it is highly sensitive to outliers.

Advantages:
- Easy to calculate
- Shows the spread of data
- With the mean, it shows the distribution of values around the mean which is a statistically more useful quantity
Limitations:
- It depends on only two values and ignores the rest. A particular problem if extreme values are atypical.
- The range increases as the sample size increases.
Quartiles split the ranked dataset into 4 segments with an equal number of values per segment as shown in the figure below.
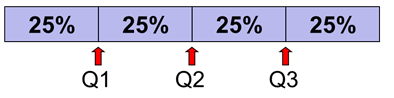
First quartile position: Q1 = (n+1)/4 ranked value
Second quartile position:Q2 = (n+1)/2 ranked value
Third quartile position:Q3 = 3(n+1)/4 ranked value
where n is the number of observed values
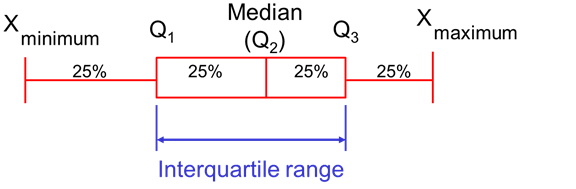
The semi-interquartile range (or SIR) provides the difference between the first and third quartiles divided by two. The first quartile is the 25th percentile. The third quartile is the 75th percentile. To calculate SIR, we first find the median of the upper and lower half, then take their difference.
SIR = (Q3 – Q1) / 2
Consider the range of numbers below:
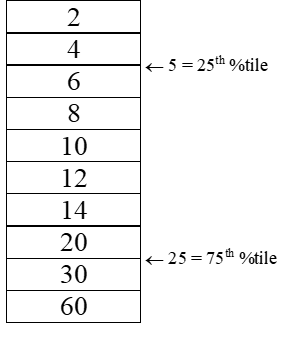
Notice that 25
The range of this set of numbers, R = 60 – 2 = 58
Therefore, SIR = (Q3 – Q1) / 2 = (25 – 5) / 2 = 10