Statistics – Measures of dispersion: Standard deviation
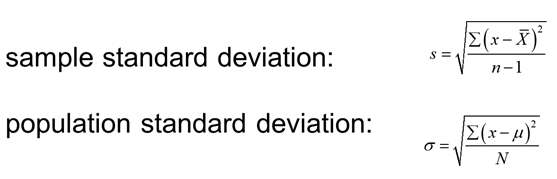
Standard deviation (SD) is a measure of how each value in a data set varies or deviates from the mean. The standard deviation is calculated by deducing the square root of the variance. It is denoted with the same units as the original data.
Assuming that all values within each class interval are located at the midpoint of the class, SD for grouped data can be calculated as follows:
Where n = number of data points or sample size
x = midpoint of the jth class
f = number of data points in the jth class
The smaller the SD, the less the data varies about the mean. The larger the SD, the more the data will vary about the mean.
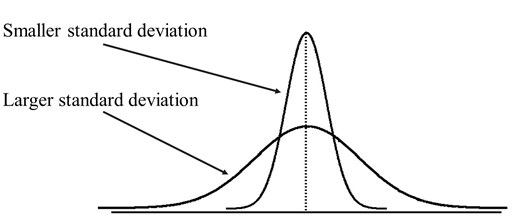
As shown in the graph above, the more the data are spread out, the greater the range, variance, and standard deviation. Likewise, the less the data are spread out, the lower the range, variance, and standard deviation. If the data points are all the same, all the dispersion measures are zero. None of these measures is ever obtained in the negative range.
Steps for finding the standard deviation:
- Find the mean of the dataset: $\bar{x}$
- Find the difference between each data value and the mean: $x-\bar{x}$
- Square the difference: $(x-\bar{x})^{2}$
- Find the average of these squares: $\sum{\frac{(x-\bar{x})^{2}}{n}}$
- Take the square root to find the standard deviation: $s=\sqrt{\sum{\frac{(x-\bar{x})^{2}}{n}}}$
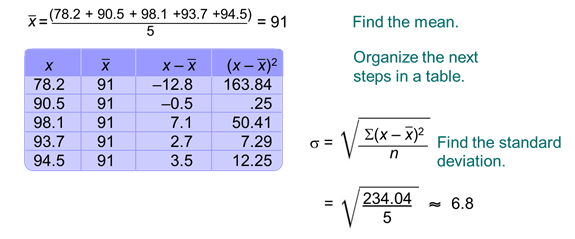
Example: Find the mean and the standard deviation for the values 78.2, 90.5, 98.1, 93.7, 94.5.
Example: Compare the mean and standard deviation for the number of trucks sold by the 2 dealers.
Dealer 1: 8, 9, 15, 25, 20, 16, 24, 18, 21, 14, 16, 10
mean = 16.3 ; standard deviation = 5.34
Dealer 2: 7, 4, 10, 18, 21, 30, 27, 20, 16, 18, 12, 9
mean = 16; standard deviation = 7.6
On average, Dealer 1 sells more cars per month than Dealer 2. Dealer 1 has a smaller standard deviation than Dealer 2. Therefore, the amount of cars hat Dealer 1 sells from month to month varies less than that of Dealer 2. That is, Dealer 1 is more consistent in the number of cars he sells than Dealer 2.
To interpret SD, or to make a plausible estimate of the SD of some data, the mean deviation is useful because it is easier to estimate the magnitude of the MD. The SD has approximately the same numerical magnitude as the mean deviation, though it is almost always somewhat larger. The SD can not be less than the MD;the SD is equal to the mean deviation if the data is distributed in a maximally “polarized” fashion; Otherwise, the SD is larger than the MD and it is typically about 20-50